
The survey problem
Why does this tool never work the first or second or third time??????
A customer typed that into a support ticket. The ticket closed unresolved. AI scored the conversation a 1 out of 5.
The CSAT system’s record of this customer? Nothing. No survey was ever filed. On the satisfaction dashboard, this person does not exist.
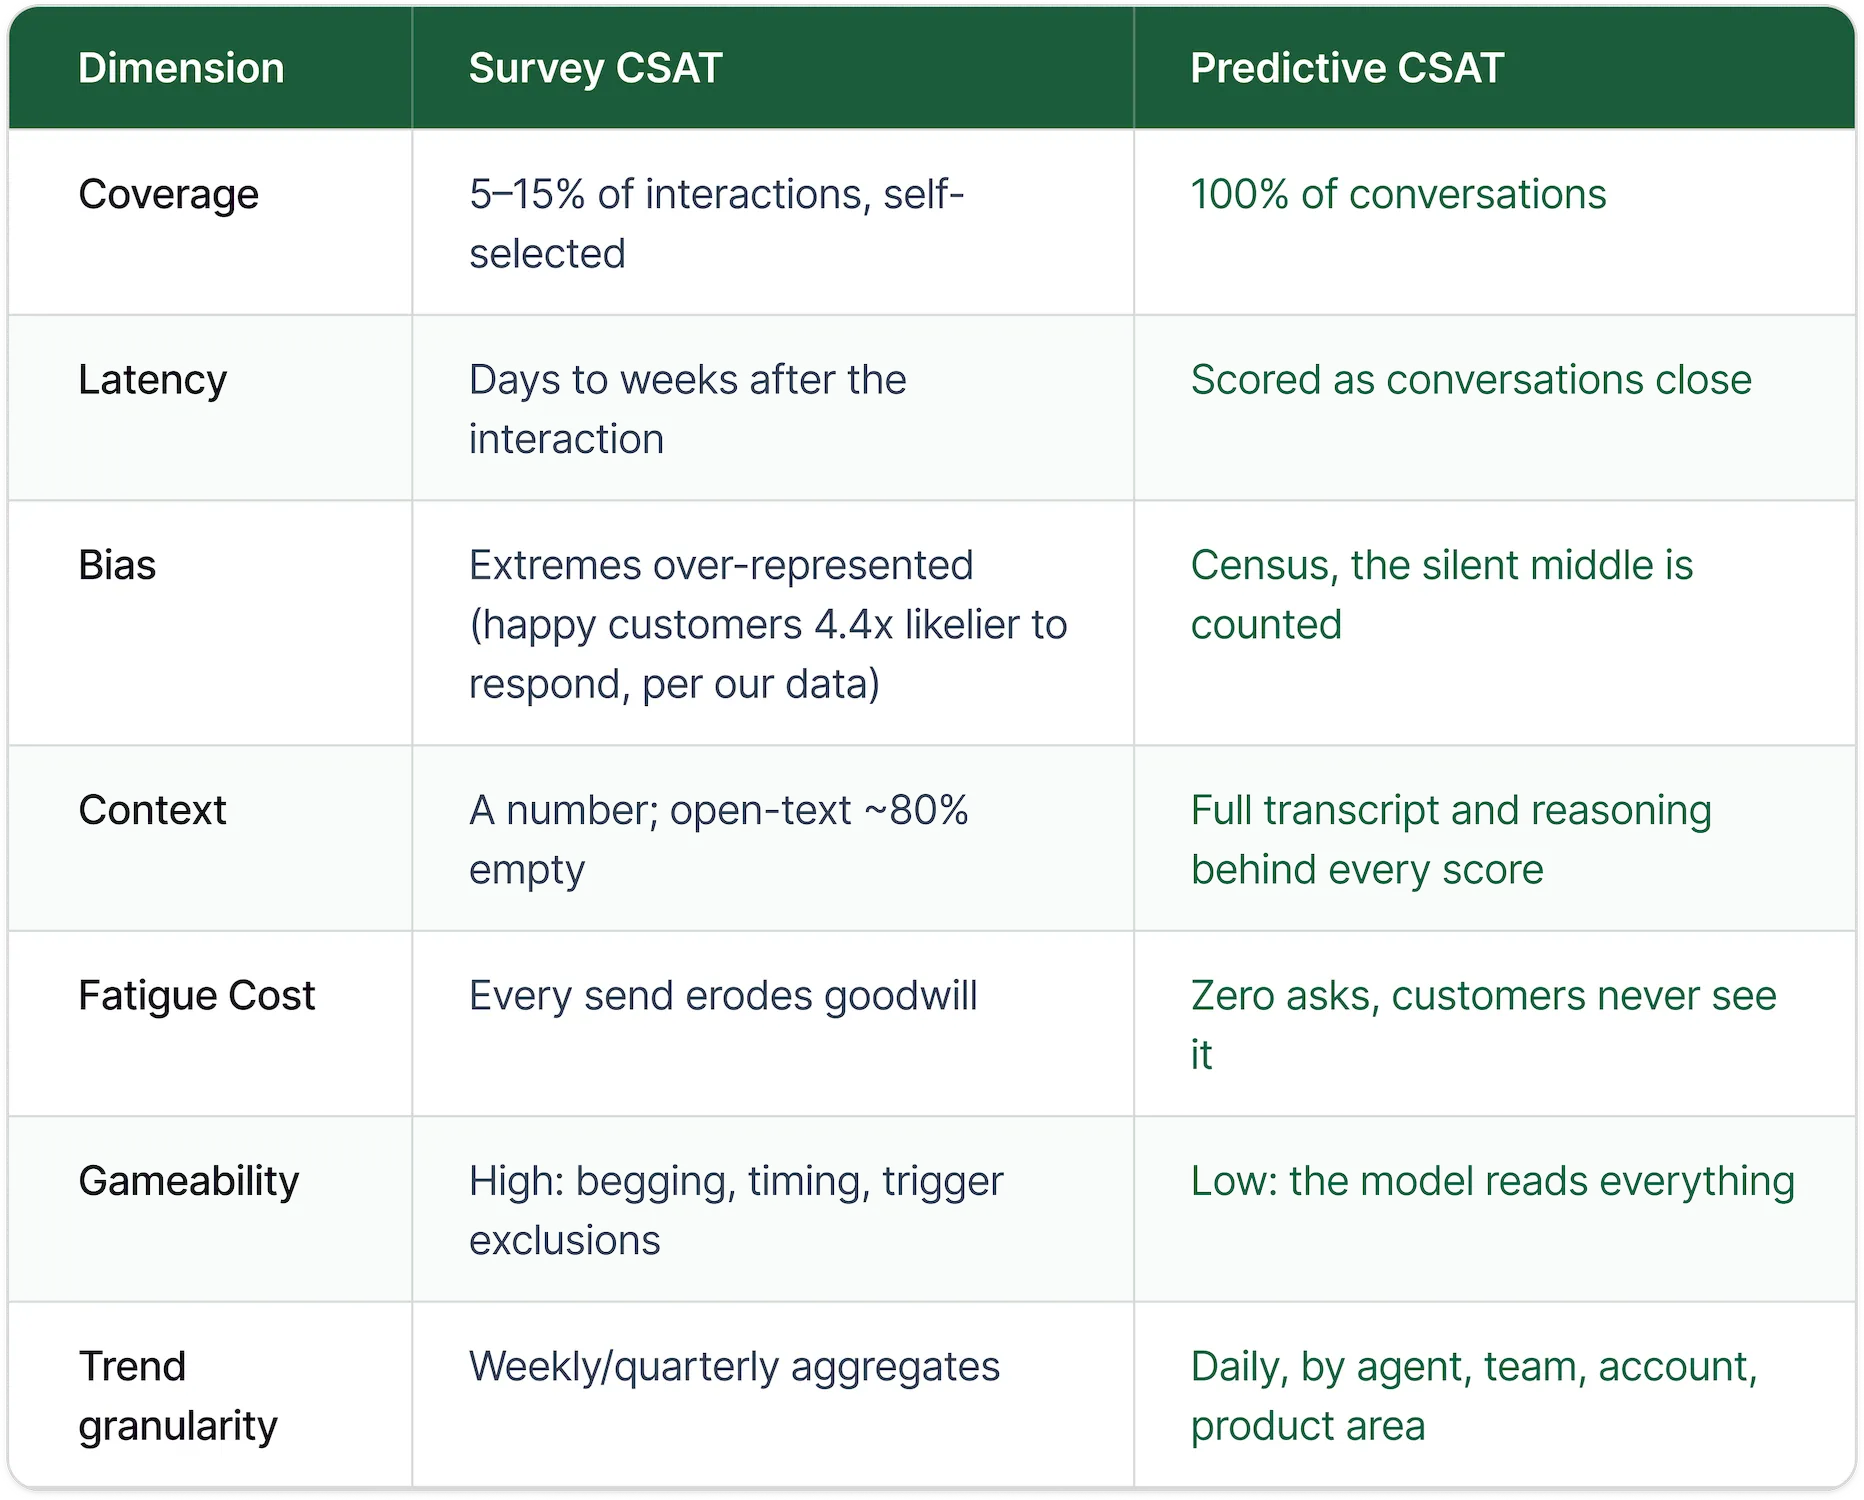
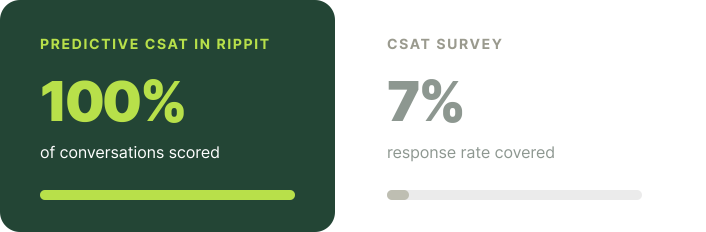
That’s the survey problem in one ticket. You survey everyone, 5–15% respond, and the happiest and angriest dominate the sample, so the number your exec team stares at describes a sliver of reality, days late, with zero explanation attached.
The answer to “are our customers satisfied?” was never in the survey. It was in the conversation the whole time, and AI can now read 100% of them and infer satisfaction continuously.
This playbook contains the evidence surveys are broken, and exactly how predictive CSAT and NPS work, with original data from one B2B SaaS support workspace (Rippit’s own).
What is Predictive CSAT?
Predictive CSAT is an AI-generated customer satisfaction score inferred from the fullcontent of every customer conversation, rather than from post-interaction surveys. Machine learning models read each transcript, sentiment, effort, resolution, tone trajectory, and assign a satisfaction score to 100% of interactions, eliminating the response-rate and response-bias problems of survey-based CSAT.
Predictive CSAT (pCSAT): An AI-inferred satisfaction score produced for every conversation by analyzing the transcript itself, sentiment trajectory, customer effort, resolution, escalation language, instead of waiting for a survey response. Scores exist per conversation, agent, account, and segment, updating continuously.
What is Predictive NPS?
Predictive NPS is an AI-inferred loyalty score built from advocacy and churn signals insidecustomer conversations, praise, recommendation language, repeat frustration, competitormentions, cancellation threats, instead of the “how likely are you to recommend us?”survey. It applies the same conversation-scoring approach as predictive CSAT torelationship-level loyalty rather than single-interaction satisfaction.
Predictive NPS: A loyalty metric inferred from conversation data across a customer’s full history. Where survey NPS samples stated intent once or twice a year, predictive NPS reads expressed loyalty and churn risk continuously, across every touchpoint.
The term barely exists in the literature yet. It should. When a customer tells support they’ve “had to fight to keep this product around” and “can’t justify that fight anymore,” that’s the loudest detractor signal there is, and no NPS survey will ever capture it.
Why are CSAT and NPS surveys unreliable?
CSAT and NPS surveys are unreliable because they measure a small, self-selected sampleof customers. Typical response rates run 5–15%, the happiest and angriest respond most,results arrive days after the interaction, and the score carries no explanation. The output isa biased, lagging, context-free number that’s easy to game.
We don't know if our customers are happy currently because we're sampling two percent of the interactions at best.
What is the average survey response rate?
Across survey types, average response rates run roughly 5–15%. Retently’s survey response-rate study puts NPS surveys at about 4.5%, CSAT at 9.8%, and CES at 22.5%. Email surveys typically land at 15–25%, and post-call surveys capture just 3–5% of interactions. Rates have declined for years.
What is survey response bias?
Survey response bias is the distortion that occurs when customers who answer a survey differ systematically from those who don’t. The extremely happy and extremely angry respond most; the ambivalent middle stays silent. The resulting score describes your loudest customers, not your customer base, and it skews high, with CSAT scores clustering above 70%.
Nonresponse / self-selection bias: The error introduced when survey participation is voluntary and uneven. If customers who opt in differ from those who opt out, in mood, outcome, or loyalty, the sample stops representing the population, no matter how many responses you collect.
So we measured it. In an analysis of one B2B SaaS support workspace (Rippit's own), we ran AI review over a random sample of 500 support conversations and cross-tabbed transcripts against the actual survey records:
- Happy customers were 4.4x more likely to answer the survey than frustrated ones. 36.9% of conversations with clear positive signals in the customer's own words produced a score; 8.3% of those with clear negative signals did.
- The survey program caught 2.4% of genuinely dissatisfied customers. AI review found 82 conversations with genuine dissatisfaction. Only 8 ever produced a survey response, and 6 of those 8 still left a 4 or 5. Net: 2 of 82 dissatisfied customers registered as a low score.
- The survey said 96% happy; the transcripts said 75%. Of 3,681 survey responses in the workspace, 95.9% were 4s or 5s (average 4.76/5, textbook ceiling effect). AI-predicted scores on the scoreable random sample: 7.8% at 1–2, 24.9% at 3 or below, roughly 4x more clear dissatisfaction than the survey record shows.
One more finding, stated as narrative because the count is small but perfect: every conversation containing explicit churn-risk language, cancellation talk, competitive displacement, produced zero survey responses. The customers most likely to leave were exactly the ones the survey never heard from.
(This workspace's 24.2% response rate beats industry benchmarks, so these blind-spot numbers are conservative.)
Even respondents mislead. One customer wrote "I just deal with it now, its not ideal I just don’t know what else to do about it", and left a CSAT of 5 on that ticket.
Why are surveys lagging indicators?
Surveys report on interactions that are already over. By the time a bad score lands, if it lands, the ticket is days old, the aggregate report is weeks out, and the customer may be gone. The dissatisfaction was visible in the conversation long before any survey was sent.
We measured this too. Of the 151 conversations in the same workspace that received a 1–3 survey score, 88% contained clear dissatisfaction language an AI could have flagged in real time, before the ticket closed. One customer (no survey ever answered): "ive gotten it for several days now and someone said they fixed it but its not actually fixed." That signal sat unread in a transcript.
of tickets contained clear dissatisfaction language an AI could have flagged in real time, before the ticket closed
How bad is survey fatigue?
Bad, and worsening. Survey requests are up roughly 71% since 2020, a typical customer now fields about 12 survey requests a month, and around 70% of respondents abandon surveys partway, a pattern Koji's research corroborates. Every survey you send now carries a small negative CX cost of its own.
Survey fatigue: The declining willingness of customers to start or complete surveys as request volume grows, degrading both response rates and answer quality.
Read that back: the instrument you use to measure customer experience is making the customer experience worse.
How do teams game CSAT and NPS scores?
When a metric becomes a target, it stops measuring. Scores get gamed on both sides: agents pleading for 5s, the dealership-style "anything less than a 10 hurts me" speech, hard ticket types quietly excluded from survey triggers, sends timed for peak gratitude. WalkMe's survey critique catalogs the classics.
Honesty break: we searched our own 500-conversation sample for score-begging and found zero instances. But the gaming shows up one layer down, in the sampling. A customer told us on a call:
There are some bad actors out there that realize that and will apply that tag, knowing that QA is only reviewing less than 5% of their overall tickets.
When coverage is a sample, people hide in the unsampled 95%. At 100%, there's nowhere to hide.
What does a CSAT score actually tell you?
Almost nothing. A "2/5" carries no why, and the open-text box that's supposed to supply it goes more than 80% unanswered.
Sometimes the number is actively wrong. One customer in our dataset wrote "disappointing doesn't even cover it", and the survey they answered logged a middling 3. The transcript reads like a 1. Only one of the two can tell you what to fix.
The why was in the conversation the whole time. So why not just read the conversation?
Is NPS dead?
What Gartner predicted, and what actually happened
In 2021, Gartner predicted more than 75% of organizations would abandon NPS as a success measure for customer service and support by 2025.
It didn't quite happen, and we won't pretend it did. As CMSWire and Survicate chronicle, NPS survived in usage but lost influence: demoted from north star to one signal among many. And research covered by CustomerThink found ~52% of NPS respondents both promote and criticize the same brand, the single number was always a fiction of averaging.
The question isn't "do we kill NPS?" It's: why is a survey with a ~4.5% response rate your loyalty system of record?
What are the alternatives to NPS surveys?
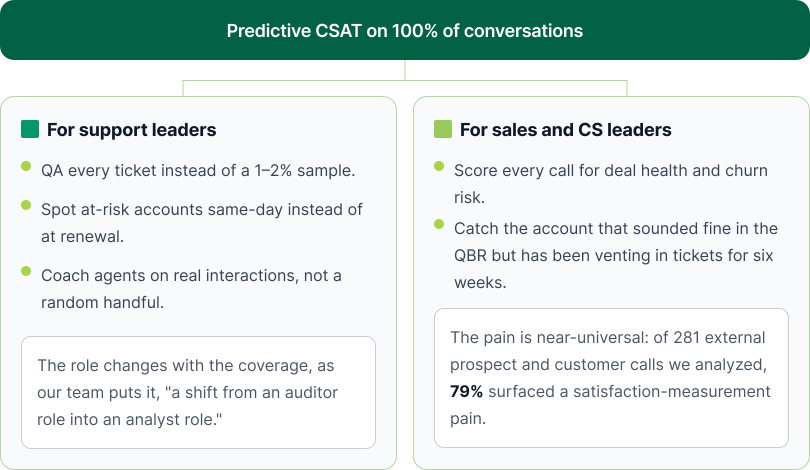
The commonly cited alternatives to NPS are other survey metrics, CSAT, Customer Effort Score (CES), retention rate, but they inherit the same response-rate and bias problems, because they're still surveys. The structural alternative is predictive scoring: predictive NPS and predictive CSAT infer loyalty and satisfaction from 100% of conversations, replacing a biased sample with a census.
The alternative to a broken survey isn't another survey.



.webp)